
Explainer Science · Virginia
A forty-percent rain chance is not forty percent of your afternoon
What a forecast percentage describes, why two periods cannot simply be added, and how a transparent classroom example helps without pretending to forecast Southside weather.
Checking whether this browser can read the story aloud.
Explore related topics
Sources & editorial review
Sites editorial review recorded for this exact revision. This AI-assisted article or learning resource includes source links and credited contextual imagery.
This is a local editorial review, not a canonical Cultural Imprint Engine assessment. No CIE score is claimed. Source review does not verify third-party playback, provider availability or image pixels.
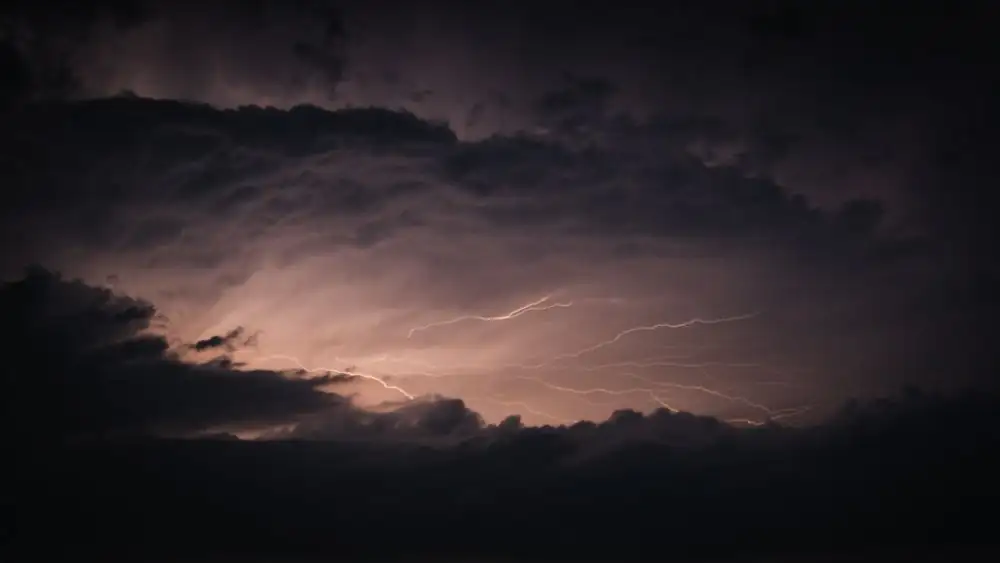
Photograph · source and license
The image, credit, reuse license, editorial context and delivered file are recorded in the exact Sites editorial review. This review is separate from the article’s canonical CIE assessment.
Image and publication standards →In this story
Put a question beside the percentage
A rain percentage can look more complete than it is. A reader planning an afternoon in Gretna may want to know whether to carry a coat, whether an outdoor task will be interrupted or whether the ground will receive enough water.
Those questions are related, but one percentage does not answer all of them. Start by identifying exactly what event the forecast number describes.
The National Weather Service’s explanation of probability of precipitation defines it as the chance that the forecast point or grid will receive at least 0.01 inch of precipitation during the forecast period. Its teaching page uses an older Georgia forecast to illustrate the definition.
That is educational material, not today’s forecast for Virginia. This article applies the definition to original hypothetical examples; it reports no present rain chance for Gretna, Danville, Halifax or Pittsylvania County.
The unit is not an hour
Imagine a made-up forecast period running from noon to six. A forty-percent chance does not tell us that rain will occupy forty percent of those six hours.
Calculating 0.4 times six would produce 2.4, but the arithmetic would answer a question the percentage never posed. The number is a probability of a defined precipitation event, not a share of the clock.
Nor can that probability be read as a rainfall amount. Two imaginary situations might both meet the threshold while delivering different quantities.
One might interrupt a task briefly; another might affect it for longer. To understand an actual forecast, retain its location and time window, then look for the separate information relevant to timing and amount.
Do not fill a missing field by converting a percentage into whichever unit the day’s plan happens to need.
Ten cards show why a chance is not a schedule
For a classroom exercise, make ten equally likely cards. Mark four with the defined precipitation event and six without it.
Drawing one card represents one imaginary outcome. The deck assigns forty percent to the event, but it does not say which of ten actual dates would be wet.
Replacing and reshuffling after each draw does not guarantee exactly four marked results in ten draws.
The cards are deliberately simple. They do not reproduce the way forecasters create a weather prediction, and they are not a set of observed Southside days.
Their purpose is to separate a probability assigned before an outcome from an observation made afterward. A marked card does not make the original forty-percent statement wrong, and an unmarked card does not establish that the chance was zero.
Both outcomes were included in the exercise.
Two forecast periods need more than addition
Now give each card two columns: an early period and a late period. In the first invented deck, two cards show precipitation early only, two late only, two in both periods and four in neither.
Each period has four marked cards out of ten. Yet six cards show precipitation in at least one period.
Adding forty and forty would give eighty, while this deck’s combined share is sixty.
Build a second invented deck with four cards marked in both periods and six in neither. Each separate period still has four marked cards, but now only four cards show precipitation at any time.
The separate percentages are identical across the two decks; the combined result differs because the overlap differs. These are transparent teaching arrangements, not competing forecasts.
They show why a reader cannot recover a combined-period probability from the two individual numbers alone.
A dry outcome is not a complete forecast evaluation
Suppose an imaginary forecast assigns forty percent and no precipitation occurs at the specified point during its period. That single result establishes the outcome for that case.
It does not, by itself, establish how well a forecasting method performs across many cases. Calling every forecast below certainty a failed promise would erase the uncertainty the number was intended to express.
Equally, a wet outcome cannot prove that a method is consistently accurate. An evaluation needs an agreed set of comparable forecasts, the original probabilities, the matching locations and periods, and the corresponding observations.
Changing the comparison after seeing the outcome makes the exercise less informative. This article supplies neither a local performance dataset nor a verdict on any forecast office.
Its narrower point is that prediction and evaluation answer different questions.
A decision can include consequences without changing the number
Consider two hypothetical neighbors looking at the same forecast. One is deciding whether to sit outside briefly.
The other is deciding when to begin a task that would be difficult to interrupt. They may make different plans because the consequences differ.
That does not require one neighbor to reinterpret forty percent as eighty or the other to round it down to nothing.
Write the action separately from the forecast. What would interruption cost in time or effort?
Is there a reversible alternative? When will the next supported update be available?
These are planning questions, not a formula that makes weather predictable. An emergency alert or an activity’s adopted safety rule also answers a different question from the chance of measurable precipitation; a low rain percentage should never be presented as a general permission to ignore hazards.
Keep the original forecast attached to the discussion
When sharing an actual forecast, include the location, period and issue time rather than a detached screenshot of one number. A later forecast can change, and a town name on a phone display may cover a different point from the place where someone is working.
Those details should be resolved from the current official product, not reconstructed from memory after the trip.
For a family discussion, return to the ten-card exercise and ask three questions: what outcome was defined, which period did it cover, and what information remains missing? That keeps the percentage useful without making it carry a rainfall total, timetable or regional conclusion.
The goal is not to distrust a forecast because it contains uncertainty. It is to read the uncertainty accurately enough to ask the next practical question.
Sources & verification
Definition: probability that forecast point/grid receives at least0.01inch during forecast period; page uses older Georgia teaching forecast, not current Virginia conditions. All cards, numerical layouts and decisions are original hypothetical analysis, not weather observations or a claim about operational forecasting methods.
Read the sourceThis article was written with AI assistance from the linked sources. No firsthand interview or visit is implied. Source dates and limits are identified in the reporting. Advertising does not determine editorial coverage. Request a correction or read our standards.
EVERY NEIGHBOR HAS A VOICE
Keep the conversation going.
Share experiences, ask questions and link evidence for factual claims. Automated publication checks apply to each submitted version. Comments are independent community discussion, not submissions to a government body.
Sign in to join · freeCommunity standards