
Explainer Science · Virginia
A radar color describes an echo before it describes your yard
Understanding the product and timestamp makes a familiar weather picture more useful.
Checking whether this browser can read the story aloud.
Explore related topics
Sources & editorial review
Sites editorial review recorded for this exact revision. This AI-assisted article or learning resource includes source links and credited contextual imagery.
This is a local editorial review, not a canonical Cultural Imprint Engine assessment. No CIE score is claimed. Source review does not verify third-party playback, provider availability or image pixels.
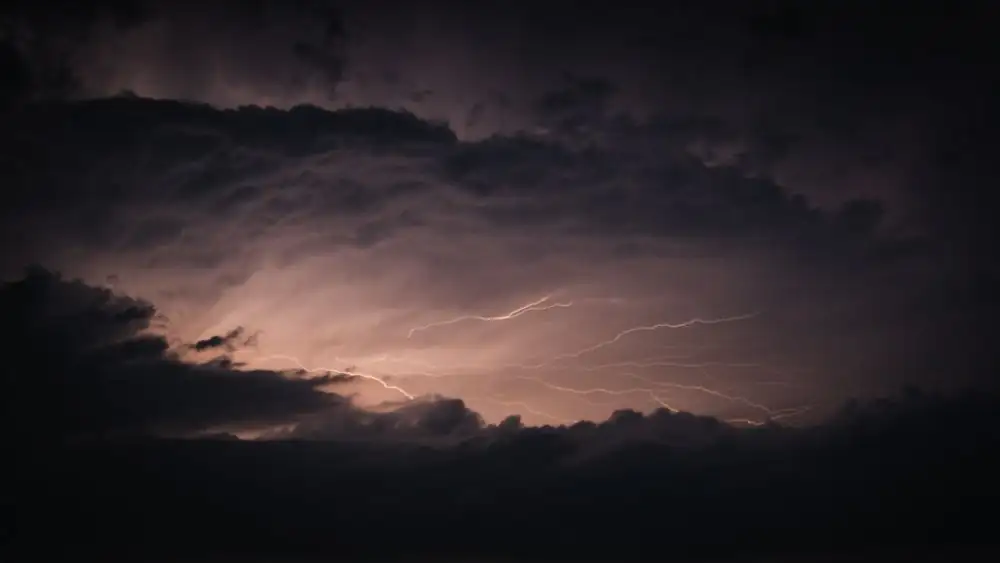
Photograph · source and license
The image, credit, reuse license, editorial context and delivered file are recorded in the exact Sites editorial review. This review is separate from the article’s canonical CIE assessment.
Image and publication standards →At a glance
- Read the product, legend and displayed time.
- A radar echo and a surface observation are different evidence.
In this story
The picture begins with a measurement
The National Weather Service explains that weather radar sends radio pulses and measures returned energy. Its radar FAQ describes reflectivity as echo intensity, with products expressed in dBZ.
The familiar colors therefore belong to a measured product and its display scale. They are not a direct observation of the weather at every house represented by the map.
For a reader in Gretna, Danville or the Bedford area, the first step is to read the product label and timestamp. A radar screenshot can travel through a neighborhood conversation long after the displayed scan.
A bright patch may be relevant to a weather question while still leaving unanswered what is happening at a particular ground location now.
Check which picture you opened
NWS describes several radar products, including base and composite reflectivity. Its tutorial also cautions that a precipitation-type display samples returns at the radar beam’s height and may not match the type at the surface.
This is a useful limitation to preserve when a map appears to settle whether rain, snow or another form is reaching a local place.
An original learning exercise uses two saved public radar images from the same documented time. Label the product on each and copy its legend.
Ask which visible differences could come from the product definition rather than a change in weather. Do not infer a new storm or local condition simply because the colors differ.
The exercise is about reading the display, not producing a forecast.
Keep observation and interpretation apart
If looking outside from a safe indoor place, a reader can write a plain observation such as rain visible at the window and give the time. Keep that statement separate from the radar interpretation.
The observation applies to that place and moment; it does not establish what is happening across the whole town. Likewise, the radar product can describe echoes without confirming every surface detail.
For a classroom-style discussion at home, draw three boxes labeled measurement, display and decision. Place the radar echo in the first, the color scale in the second and the question about an outdoor plan in the third.
Add the other information needed for the decision. This original exercise helps explain why a weather image, a forecast and an official warning serve related but different purposes.
Use official instructions for decisions
Read the current NWS forecast, watches and warnings and follow responsible local instructions for the actual situation. A saved radar image should not become reassurance that a route or outdoor activity is safe.
This article makes no live weather claim and offers no all-clear. It explains the evidence behind a commonly shared picture so a reader can ask a more precise question.
When sharing a radar image for an educational discussion, include its source, product name, displayed time and legend. Avoid a caption that turns a historical screenshot into a current alert.
If the point is to explain an earlier event, label the image historical and identify the period examined. Those small labels help an informative science picture stay informative as it moves beyond the person who first opened it.
For a later comparison, save the legend with the image. A color without its scale can lose its meaning when display settings change.
Sources & verification
Opened official definitions of reflectivity products and units. Checked October 3, 2026.
Read the sourceOpened official beam-height and surface-precipitation limitation. Checked October 3, 2026.
Read the sourceOpened official radio-pulse measurement explanation; no live weather inferred. Checked October 3, 2026.
Read the sourceThis article was written with AI assistance from the linked sources. No firsthand interview or visit is implied. Source dates and limits are identified in the reporting. Advertising does not determine editorial coverage. Request a correction or read our standards.
EVERY NEIGHBOR HAS A VOICE
Keep the conversation going.
Share experiences, ask questions and link evidence for factual claims. Automated publication checks apply to each submitted version. Comments are independent community discussion, not submissions to a government body.
Sign in to join · freeCommunity standards