Explainer Science · Virginia
One region, several water questions: build a map with separate layers
Drainage, supply planning and water-quality assessments should each keep their own boundaries and evidence.
Checking whether this browser can read the story aloud.
Explore related topics
Sources & editorial review
Sites editorial review recorded for this exact revision. This AI-assisted article or learning resource includes source links and credited contextual imagery.
This is a local editorial review, not a canonical Cultural Imprint Engine assessment. No CIE score is claimed. Source review does not verify third-party playback, provider availability or image pixels.
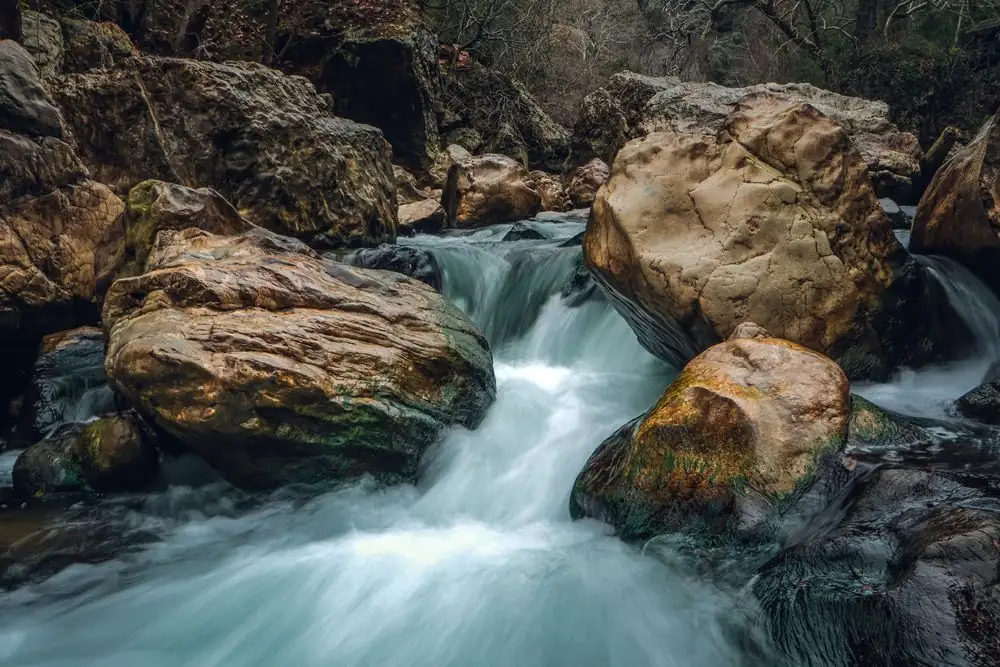
Photograph · source and license
The image, credit, reuse license, editorial context and delivered file are recorded in the exact Sites editorial review. This review is separate from the article’s canonical CIE assessment.
Image and publication standards →At a glance
- Drainage, planning and assessment boundaries answer different questions.
- Label the publication date, period covered and retrieval date separately.
- A mapped connection alone does not establish causation.
In this story
Begin with the question, then choose the map
A resident can ask where rainfall drains, how a community plans its water supply or what a monitoring record says about water quality. Those questions may concern the same landscape, but they require different evidence.
A useful regional science discussion begins by naming the question before assembling a map. Otherwise, a clear-looking boundary can give the impression of an answer it was never designed to provide.
Virginia DEQ’s major-river-basins map layer describes watershed areas within Virginia and includes named basins such as James and Roanoke. USGS’s hydrologic-unit resources explain standardized drainage-area descriptions.
DEQ’s state water-resources-plan page describes compilation of locality planning, withdrawal and permitting information. DEQ’s integrated-report resources address water-quality assessment.
Each is a starting point with its own purpose. This article extracts no live values and makes no determination about a local supply or sample.
Layer one: the land that drains together
For drainage, choose a location and an outlet using the relevant official hydrologic mapping. Preserve the layer name and scale.
A larger basin can contain smaller drainage areas, so the map must match the question’s size. Do not identify the drainage of a real parcel from an approximate sketch.
If the public layer cannot resolve the detail needed, record the limitation and seek appropriate technical help.
An original paper exercise starts with an imaginary landscape containing two ridgelines, several tributaries and two outlets. Give it no real town names.
Trace a different contributing area for each outlet. Then draw a town boundary across the drainage lines.
The exercise shows how a political boundary and a water-flow boundary can overlap without performing the same job. It should remain a model, not a map of a local neighborhood.
Layer two: the people and systems making plans
A supply-planning document concerns an organized planning process, including information from localities and water-use records. Read its date, geographic scope and stated assumptions before using it to describe the present.
A planning estimate should retain its scenario label. The word future on a chart deserves attention: a projection is a tool for examining a possible condition, not an observation that the condition has already arrived.
For an original reading worksheet, put the planning document’s boundary in one column and the drainage boundary in another. Ask which agencies or systems are included and which are outside the planning scope.
Keep source wording where the document explains those relationships. If a household’s service provider is unknown, establish that fact from the appropriate service record before linking the household to a larger planning discussion.
Layer three: the quality question
Water-quality assessments should retain the waterbody, parameter, period and use being assessed. A basin-wide label cannot by itself explain a particular sample, and an assessment of a stream does not automatically establish the condition of a drinking-water distribution system.
Read the relevant assessment material and the actual system or laboratory records for the specific question. The geographic relationship is useful context, not proof of equivalence.
DEQ’s integrated-report page is an official destination for assessment materials. When a document is a draft, retain that status and the publication date in your notes.
Do not quietly replace draft with final because the chart looks finished. If the page only provides a summary, follow the source trail before making a detailed claim.
This draft uses the destination for its purpose and reproduces no assessment finding about a named local waterbody.
Layer four: time
A map assembled from documents published in different years needs a visible date for every layer. Older basin boundaries may remain informative while a planning document or monitoring series has a different period.
Do not make the whole display appear current by giving it only today’s retrieval date. Retrieval tells readers when you looked; the source period tells them what was examined.
An original timeline exercise can give each document a card with three dates: publication, period covered and retrieval. If one date is missing, leave the field open.
Arrange the cards in two ways, first by publication and then by period covered. The different order helps explain why a recently posted report may describe earlier conditions.
It also helps a community meeting distinguish new information from a new link to old information.
What the combined display can establish
A careful layered display can show which documents address a region and how their boundaries relate. It can help readers find the responsible planning process or identify which stream measurement would be relevant to an inquiry.
It cannot demonstrate that one activity caused a later observation simply because the two places appear connected on the map. A causal claim requires a suitable study and supporting evidence.
For a hypothetical comparison, imagine an upstream land change and a downstream observation on separate cards. Ask what evidence is missing: timing, measured conditions, alternative explanations and a method capable of linking cause and effect.
The point is to improve the research question. It is not to assign responsibility to an actual landowner, business or locality.
Keep real allegations out of a model exercise unless independently verified reporting supports them.
Make the public explanation legible
Use a legend that identifies every source and describes the layer in ordinary language. A reader should be able to tell drainage area from planning area and measured condition from scenario.
Keep the main claim close to the evidence that supports it. If a question remains unresolved, state what record or expert interpretation would be needed rather than filling the space with a confident guess.
For Southern Virginia readers moving among Danville, Altavista, Brookneal and larger regional centers, the payoff is a shared vocabulary. A meeting can address drainage relationships without losing the separate responsibilities for supply planning and assessment.
A family can understand why the map relevant to one question may not answer another. The useful finished product is a dated, readable set of layers with a clear path back to the sources, allowing the next discussion to begin from the same evidence.
Sources & verification
Opened official layer description and named basin values; no parcel or town drainage determined. Checked October 3, 2026.
Read the sourceOfficial standardized drainage-unit context. Checked October 3, 2026.
Read the sourceOfficial indexed description of planning inputs. HTML returned 403; no planning figures or findings used. Checked October 3, 2026.
Read the sourceOfficial indexed assessment destination. HTML returned 403; no local assessment finding or complete report-period claim reproduced. Checked October 3, 2026.
Read the sourceThis article was written with AI assistance from the linked sources. No firsthand interview or visit is implied. Source dates and limits are identified in the reporting. Advertising does not determine editorial coverage. Request a correction or read our standards.
EVERY NEIGHBOR HAS A VOICE
Keep the conversation going.
Share experiences, ask questions and link evidence for factual claims. Automated publication checks apply to each submitted version. Comments are independent community discussion, not submissions to a government body.
Sign in to join · freeCommunity standards