
Explainer Conservation · Virginia
Kerr Reservoir is not one number: a field guide to levels, releases and water-quality evidence
A lake elevation, downstream flow, forecast and sample result describe different conditions. This guide connects the official records without turning a graph into a cause.
Checking whether this browser can read the story aloud.
Explore related topics
Sources & editorial review
Sites editorial review recorded for this exact revision. This AI-assisted article or learning resource includes source links and credited contextual imagery.
This is a local editorial review, not a canonical Cultural Imprint Engine assessment. No CIE score is claimed. Source review does not verify third-party playback, provider availability or image pixels.
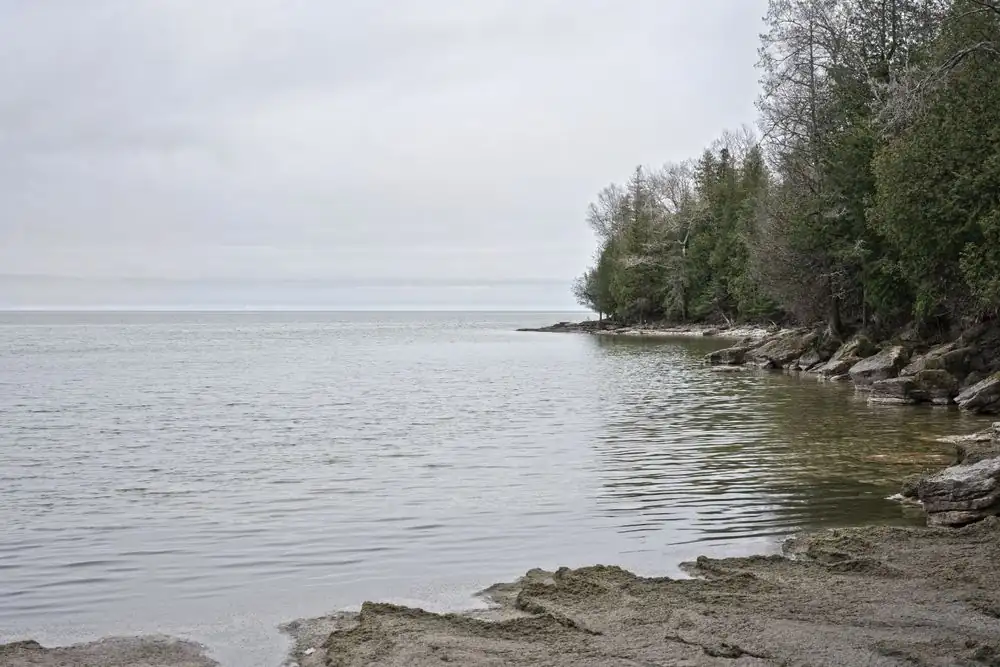
Photograph · source and license
The image, credit, reuse license, editorial context and delivered file are recorded in the exact Sites editorial review. This review is separate from the article’s canonical CIE assessment.
Image and publication standards →In this story
Name the water body and measuring point
John H. Kerr Reservoir spans a large system and is also commonly called Buggs Island Lake.
Record the official station or project name, coordinates, datum and responsible agency before quoting a value. A reading at the dam is not automatically the condition at every cove, tributary, boat ramp or downstream reach.
Place names matter when readers act on information. Identify whether a record concerns the reservoir pool, a river gage, tailwater, tributary or local intake.
Do not label a county-wide or lake-wide condition from a single convenient point unless the issuing authority does so.
Read elevation with its datum and time
USGS publishes monitoring information for Kerr Reservoir at the dam, including water-surface elevation. The number is tied to a vertical datum and timestamp.
Copy both. Mixing feet referenced to different datums or combining hourly and daily values can create an apparent change that is only a measurement mismatch.
A graph’s display interval can exaggerate or flatten movement. Retrieve the underlying values when possible and state whether data are provisional.
One falling hour does not establish a long-term trend, and a seasonal operating pattern should not be labeled drought, drawdown or emergency without the responsible agency’s context.
Separate pool level from river flow
Reservoir elevation describes stored water height at a location. Discharge describes a volume moving past a river point over time.
Operators can change releases while inflow, weather and power needs also change. A high pool and a high downstream flow are related through operations but are not interchangeable measurements.
When comparing upstream, pool and downstream records, align timestamps and units. Travel time means a release may appear later at another gage.
Missing or ice-affected data need flags. Do not infer a gate operation from a downstream spike unless the Corps or another authoritative record supports the connection.
Treat forecasts and schedules as conditional
Corps project pages and operational tools can publish lake information, forecasts or schedules. Capture the issue time and stated assumptions.
Forecasts change with rainfall, inflow, power demand and flood-control decisions; they are not promises about a future boat-ramp depth or shoreline position.
If an expected update passes, mark the forecast stale and direct readers to the official current route. Do not silently advance the timestamp because a page still loads.
An inaccessible source means verification pending, not that the lake is stable or that an operation ended.
Keep water quantity and water quality distinct
Elevation and flow do not establish bacterial, nutrient, toxin or drinking-water conditions. Water-quality evidence needs the parameter, sampling point, collection time, laboratory method, reporting unit and quality controls.
A clear-looking lake can have a problem, and a muddy lake after rain is not by itself proof of contamination.
Use Virginia DEQ, health department, utility or other responsible-source results for health or regulatory claims. Identify whether a sample is screening, compliance, recreational monitoring or a research observation.
Never convert one result into a lake-wide advisory unless the authorized agency defines that scope.
Connect rainfall without claiming sole cause
Rain gages, radar estimates, soil conditions and upstream flows help explain context. Their spatial scales differ.
A storm over one tributary can matter more locally than a regional average, while a reservoir operation can moderate or shift the timing of downstream effects.
A responsible analysis tests several explanations and identifies the evidence needed to distinguish them. Historical comparison should use like seasons and operations.
Avoid attributing shoreline erosion, algae, access problems or fish conditions to one factor solely because two lines move together.
Publish access and safety information from owners
Boat-ramp status, navigation restrictions, swimming advisories and park closures belong to the agency or site that manages them. Link the specific facility and checked time.
A lake-level graph can help explain context but should not replace an official closure or local depth assessment.
Photos from residents are useful leads when location, date and permission are clear. They do not certify current conditions elsewhere.
Preserve privacy around homes and avoid publishing exact locations of sensitive ecological or archaeological resources.
Create an updateable lake record
A durable card shows station identity, latest verified observation, datum, provisional status, responsible agency, related flow point, official advisory links and next check time. Archive closed advisories and old forecasts so shared links cannot masquerade as current instructions.
For accountability reporting, retain the raw values, retrieval times and transformation code. Ask operators and regulators about material discrepancies before publication.
The result should let a reader reproduce the chart and understand its limits—not merely trust an unlabeled line.
Work a storm-to-lake example with separate clocks
A forecast calls for heavy rain in part of the basin. Save the forecast issue time and area, then identify upstream rain and flow stations rather than using one county total.
During the event, record provisional observations with their station timestamps. Do not relabel a forecast amount as measured rainfall or treat a radar estimate as a gage without saying so.
At the reservoir, record elevation and the project update. Downstream, align discharge observations with likely travel time but avoid assigning cause until the operator record supports it.
A public safety notice, ramp closure or advisory stays separate and uses the issuing authority’s geography and time.
After the event, replace provisional values only through a dated revision and preserve the original retrieval. Compare the event with a like season and operating context.
This layered reconstruction can explain timing and uncertainty while resisting the tempting but unsupported sentence that one storm or release “caused everything” observed along the lake.
If residents submit shoreline photographs, record date, permission and approximate location without exposing a private home. Compare them only with the matching water record.
A striking image can document a place at one moment, but it cannot supply an elevation, laboratory result or operating decision that the official evidence does not contain.
Sources & verification
Official monitoring-location identity and current/historical water data.
Read the sourceOfficial project, recreation and operational information.
Read the sourceOfficial Virginia water-quality, monitoring and regulatory information.
Read the sourceOfficial river observations and forecasts with issued times and status.
Read the sourceThis article was written with AI assistance from the linked sources. No firsthand interview or visit is implied. Source dates and limits are identified in the reporting. Advertising does not determine editorial coverage. Request a correction or read our standards.
EVERY NEIGHBOR HAS A VOICE
Keep the conversation going.
Share experiences, ask questions and link evidence for factual claims. Automated publication checks apply to each submitted version. Comments are independent community discussion, not submissions to a government body.
Sign in to join · freeCommunity standards